matplotlibで動画(mp4,gif)を作り、複数のグラフを表示する方法
python+numpy+matplotlibは実験・グラフ表示でお世話になる組み合わせです。
matplotlibでは動画の作成もできるので、手早くデータを可視化するのに便利です。
この時、複数のグラフの表示、subplotを用いた複数領域の作成、凡例の表示などで少し苦戦したため、記録として手順をまとめておきます。
スポンサーリンク
環境
今回のプログラムに用いた環境は次の通りです。
- windows10
- anaconda3: 4.3.1
- python: 3.5.2
- numpy: 1.13.1
- matplotlib: 2.0.2
- ffmpeg: N-91482-g8aa6d9a8d3
- imagemagick: 7.0.8-7-Q16-x64-static
動画保存に必要なもの
Python+numpy+matplotlibに加えて、mp4を保存するならffmepgが、gifで保存するならimagemagickが必要となります。
それぞれインストールしてパスを通す必要があるので実施しておきましょう。
ffmpegのDL&インストール
公式↗よりWindows版のバイナリをDLしてパスを通しておきます。
ImagemagickのDL&インストール
現在のImagemagickの最新版は7.x系ですが、windowsとimagemagick6.9以前のコマンドに衝突があったようです。(convertコマンド)
imagemagick7以降でconvertコマンドがmagickコマンドに置き換わっているので特に理由がなければ7系を使うのがさそうです。
今回は公式↗よりImageMagick-7.0.8-7-Q16-x64-static.exeをDLしてインストールします。
このファイルの選択ですが、レジストリ汚さなくて済むportable版も便利ではありそうなのですが、portable版のzipにはlegacy commandも同梱されており、取捨選択が面倒そうなのでインストール版を利用することとしました。
また、ffmpegはインストール済みなので同時インストールからはチェックを外します。
Imagemagick6系と7系の違い
公式↗に記載があり、一部を以下にまとめます。
- convert→magickに変更 (Windowsとの衝突回避)
- magickのサブコマンドへ変更(ex:
magick identify xxx.png)- animate
- compare
- composite
- conjure
- convert
- display
- identify
- import
- mogrify
- montage
- stream
matplotlibにimagemagickのパスを通す
Imagemagickのパスをmatplotlibにも通す必要があります。
matplotlibの設定を修正する必要があるので、ディレクトリを次のPythonプログラムで調査します。
import matplotlib
print(matplotlib.matplotlib_fname())
自分はanacondaの仮想環境下だったので大分深い階層にありました。
C:\Users\username\Anaconda3\envs\envname\lib\site-packages\matplotlib\mpl-data\matplotlibrcこの設定ファイルの特定の行を次のように書き換える
#animation.convert_path: 'convert' # Path to ImageMagick's convert binary.
↓
animation.convert_path: C:\Program Files\ImageMagick-7.0.8-Q16\magick.exe # Path to ImageMagick's convert binary.
matplotlibで動画を作成する方法
いよいよ動画作成に移るのですが、matplotlibではArtistAnimationを使う方法とFuncAnimationを使う方法の2通りが存在します。
- ArtistAnimation
- 事前に必要なデータをすべて与えてから動画を作成
- 既にデータがあって量が多くない場合はこちら
- FuncAnimation
- 1フレームごとにデータを与えながら動画を作成
- データを逐次取得していたり、データ量が多い場合はこちら
今回はArtistAnimationを利用します。
動画作成プログラム
以下のプログラムではArtistAnimationを用いて動画を作成しています。
#!/usr/bin/env python
# -*- coding: utf-8 -*-
"""
ArtistAnimationを用いて、mp4,gif動画を作成するプログラム
"""
import numpy as np
import matplotlib
import matplotlib.pyplot as plt
import matplotlib.animation as animation
def create_movie(show_fig=True, save_mp4=False, save_gif=False):
fig = plt.figure()
ax = []
ims = []
for i in range(6):
ax.append(fig.add_subplot(3,2,i+1))
x = np.arange(0, 10, 0.1)
y = np.arange(0, 10, 0.1)
t = np.arange(0, 20, 1)
mx = np.arange(0, 10)
my = np.arange(0, 10)
X, Y = np.meshgrid(mx, my)
first = True
for _t in t:
# subplot1: 折れ線+補助線
y1 = np.sin(x - _t)
y2 = np.cos(x - _t)
im = ax[0].plot(x, y1, "r", label="sin")
im += ax[0].plot(x, y2, "b", label="cos")
im += [ax[0].hlines([0], 0, 10, "g", linestyle="dotted", linewidth=0.5)]
if first is True:
ax[0].legend()
ax[0].set_xlim(0, 10)
ax[0].set_ylim(-1, 1)
# subplot2: 散布図
_x = np.random.normal(1,1,100)
_y = np.random.normal(1,1,100)
im += [ax[1].scatter(_x, _y, c="r", alpha=0.1, marker=".")]
_x = np.random.normal(-1,1,100)
_y = np.random.normal(-1,1,100)
im += [ax[1].scatter(_x, _y, c="b", alpha=0.1, marker=".")]
if first is True:
ax[1].set_xlim(-5, 5)
ax[1].set_ylim(-5, 5)
# subplot3: ヒストグラム
_x = np.random.normal(50, 10, 1000)
n, bin, patch = ax[2].hist(_x, color="g")
im += patch
# subplot4: 棒グラフ
_x = np.arange(10)
_y = np.mod(_x - _t, 10)
im += ax[3].bar(_x, _y, color="b")
# subplot5: 円グラフ
_x = np.random.rand(5)
patch, text = ax[4].pie(_x, colors=["r", "g", "b", "y", "c"])
im += patch
# subplot6: ヒートマップ
_z = np.cos(X-_t) + np.cos(Y-_t)
p = ax[5].pcolor(X, Y, _z)
im += [p]
if first is True:
fig.colorbar(p, ax=ax[5])
ims.append(im)
first = False
ani = animation.ArtistAnimation(fig, ims, interval=100)
if show_fig is True:
plt.show()
if save_mp4 is True:
# mp4での保存にはffpmegのパスが通っている必要がある
ani.save("plot.mp4", writer="ffmpeg", dpi=300)
if save_gif is True:
# gifでの保存にはmatplotlibにimagemagickのパスが通っている必要がある
ani.save("plot.gif", writer="imagemagick")
if __name__ == "__main__":
# print(matplotlib.matplotlib_fname()) # matplotlibの設定ファイル確認用
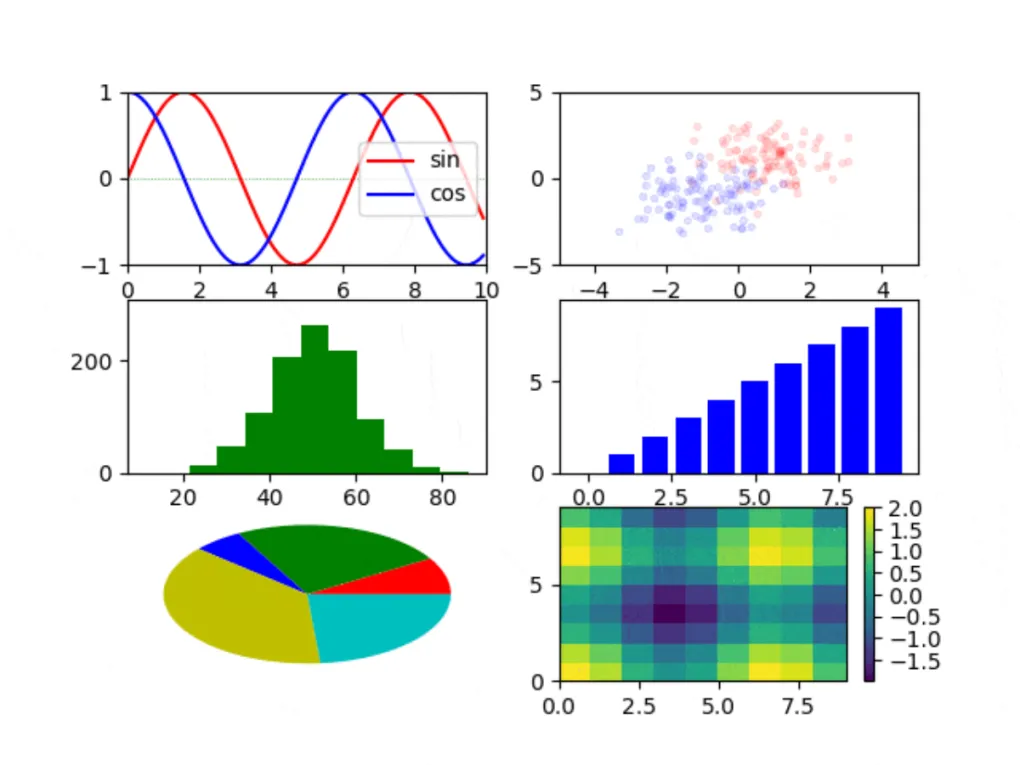
create_movie(False, True, True)このプログラムで生成したgif動画を次に示します。

大きな注意点は次の3つです。
複数のグラフを描画する場合
複数のグラフを作成する場合は、リストにappendかextendのどちらが適切か確認する必要があります。
グラフの種類(plot,histなど)によって、戻り値をリストにappendするかextendするかが異なので、使用するグラフの戻り値をマニュアルなどで確認してから使用する必要があります。
折れ線、散布図、棒、ヒストグラム、円、ヒートマップなど主要なグラフは上記のプログラムで一通り示せることを確認しました。
凡例・メモリの表示
凡例、目盛などは1回の描画で問題ないため、ループ内で1度のみ描画しています。
この表示をループ内で2回以上実施すると生成が重くなるうえ、文字が重なったりするので要注意です。
mp4を作る際はdpiに注意
mp4で動画を出力する際は、引数でdpiを指定することを忘れないようにしましょう。
これがデフォルトのままだと、画質が荒くなり非常に動画が見づらくなってしまいます。
GIFの圧縮について
生成するGIFはファイルサイズが結構大きくなってしまいます。
気になる場合はEZGIF.com↗などを使って圧縮するとよいでしょう。
透明性最適化(optimize transparency)や、色数減少(color reduction + dithe)あたりが容量削減に効果的です。
まとめ
- matplotlibで動画を生成する方法をまとめた
- ffmpeg(mp4), imagemagick(gif)が別途必要
- 複数領域、複数グラフなどを表示する際の注意点もまとめた
スポンサーリンク